Getting UK manufacturing productivity growth back on trend

Our report out today digs into the performance of UK manufacturing sub-sectors on productivity growth comparing them internationally to see where potential challenges and opportunities sit to help fix the problem.
But we don’t have all the answers so our report today is a call for evidence with a set of questions outlined where we’d like to get your feedback.
You can read the full report, Unpacking the Puzzle, here and listen to our podcast on productivity and why it matters here.
UK manufacturing had a good story to tell on productivity growth.
With growth of 4.7% between 2000 and 2007, outperforming international competitors, the whole economy average, and services. However, since 2008 manufacturing productivity growth has flat lined, at less than 1% a year.

The impact of that flat line is reflected in productivity levels – in chart 5 we created ratios between manufacturing productivity based on real GVA per hour comparing the UK against our comparators.

UK manufacturing started from a lower base but we were closing the gap in terms of levels in the run up to 2009 – indeed we did with Italy and Spain. However, as we’ve flat lined and others have continued to grow, that trend has swung into reverse and the gap has reopened.
But beyond the headline figures how have different sub-sectors of manufacturing been performing?
Prior to the 2008 financial crisis all sectors of manufacturing contributed positively to productivity growth, however, since then there has been significant divergence across sectors.
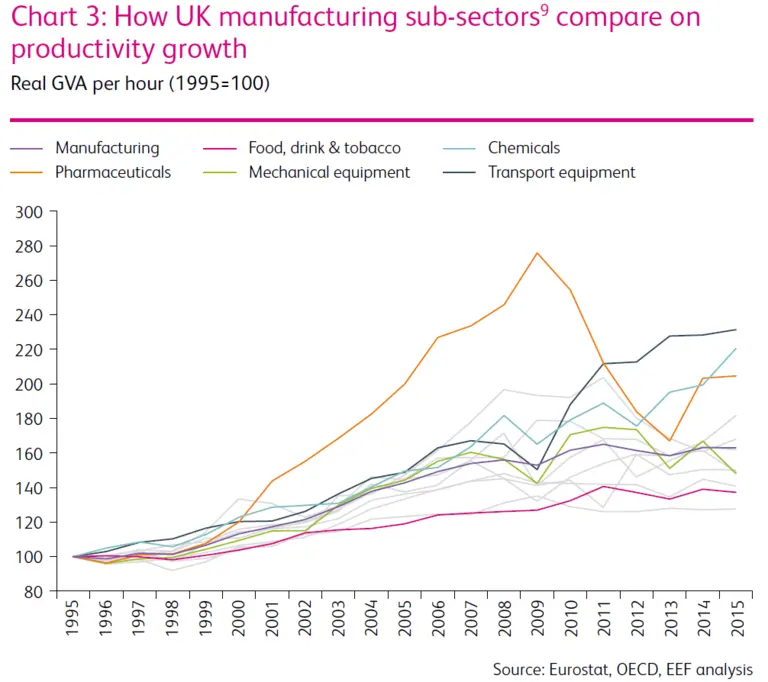
This is borne out by the five sectors we assess in our study, especially when viewed internationally:
- Transport equipment and chemicals growth outperformed internationally since 1995 and continued after the financial crisis. However on productivity levels the transport sector is still behind all three comparator countries, while chemicals has closed the gap and is now only uncompetitive against Germany.
- Pharmaceuticals growth ran in line with international growth but went into reverse after the financial crisis, however on levels the sector is still ahead of our international comparators.
- Food and mechanical equipment strongly outperformed internationally since 1995, but has seen subdued growth since the financial crisis. On levels, the food and drink sector outperforms all our comparators while mechanical equipment underperforms all three.
What could be the cause of this divergence?
Given the importance of UK manufacturing to whole economy productivity growth, the industrial strategy must focus on targeted solutions to get productivity growth back on trend. This is our central message, with many parts of the industrial strategy framework waiting for key decisions to be taken.
With a sound industrial strategy framework in place we could start to tackle some of the problems holding back UK manufacturing.
In our report we dive into some of the potential causes looking at the underinvestment in capital equipment, the higher rates of labour content in UK manufacturing, the lower levels of leadership and management capability, the more complex business operations and average company size across sectors.
Our initial assessment suggests:
- Size matters, with larger companies being able to exploit economies of scale, vertical integration opportunities and with it, higher levels of productivity. Our analysis shows sectors with a higher share of larger firms tend to outperform internationally.
- Boosting capital investment is not a silver bullet solution, for some sectors significantly investing more may not bear fruit. As an example, despite Italy having higher levels of investment in capital equipment compared to Germany, productivity levels in Italy are weaker.
- More UK manufacturing sectors undertake ancillary services as part of business operations compared to international counterparts. This suggests UK manufacturers are more likely to be at the end of value chains where the opportunities for productivity growth may be lower, but profits higher.
- Lastly, management practices across UK manufacturing do not reflect international best practice with a long-tail of companies with poor management practices. Evidence suggests companies with better management capabilities are more likely to have higher rates of productivity growth.
We’ll be holding a free webinar on Thursday exploring what the data shows in these areas in more detail - you can register for this here.
Until then you can read the full report here and respond to our call for evidence.