At the UK level, pay is trending up in most cases
Of the nine roles we were able to compare year-over-year, six experienced increases in pay, one experienced no change, and two experienced decreases in pay. The Production / Manufacturing Director and Chief Executive / Managing Director roles experienced the most significant increases in pay as a percent of basic median pay at 20% and 13% year-to-year1.
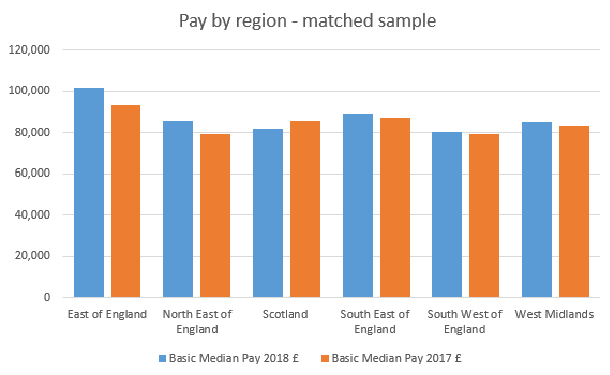
At a regional level
The East of England commands the highest basic median pay in 2018 at £101,628 increasing by 9% from 2017 which also happens to be the most significant percentage increase. The only region experiencing a decrease year-to-year is Scotland which decreased by 4%.1
And some bonus information
In 2018, 75% of directors received a bonus payment, up from 68% last year. Of those 692 directors, the average bonus was £24,968, also up from the average of £21,884 from 2017.
Beneficial data
Our Directors’ Pay Benchmark provides granularity into which benefits are offered to employees. The chart below shows the aggregated director benefits across the UK.
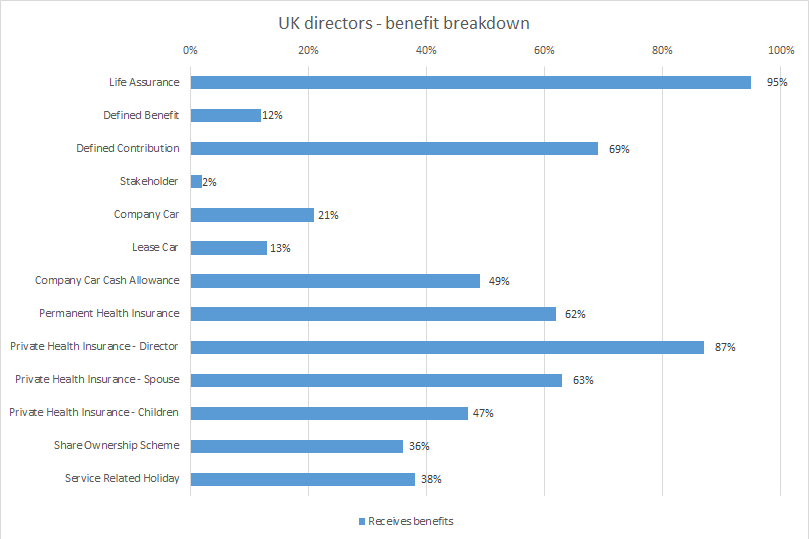
While we have provided a brief overview here, in the full report, we provide the breakdown for each director and include information related to life assurance value, pension contributions by the employer and employee, and monetary value associated with car benefits.
Want to learn more?
The Directors’ Pay Benchmark is part of a three-part series including the Workforce Pay Benchmark and Professionals’ Pay Benchmark. If you would like more information about any of the pay benchmark reports or any other benchmarks produced by the Information and Research team, please email [email protected]
1Based on matched sampling