This year's fact card highlights that manufacturing is more than just the sum of its parts punching above its weight in many areas.
It pays to manufacture
Our annual fact cards have consistently shown that average pay in manufacturing is higher than the whole economy average and the service sector average. This year is no different, but more specifically:
- Average pay in UK manufacturing is higher than the regional economy average everywhere but London
-
Average pay in UK manufacturing sub-sectors is higher than pay in the service sector except for food and drink manufacturing
- Across 2012 to 2017 manufacturing productivity growth outpaced the whole economy and services (but as we've said before there is more than can be done on that)
So what's changed since our 2017/18 fact card?
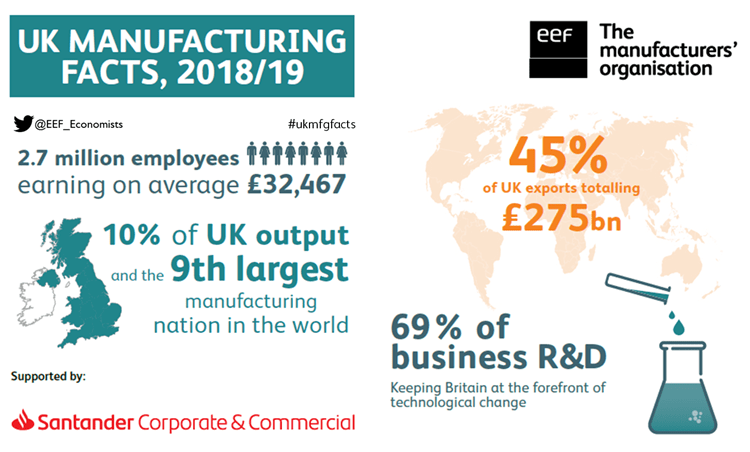
More people employed
- Total employment has gone from 2.6 million to 2.7 million
But declines in some areas
- Wales (-9k), West Midlands (-18k) and Yorkshire and Humber (-26k) are the three areas posting declines in employment
An increased share of total exports
- From 44% to 45% of UK exports totalling £275bn
But share of business R&D is slipping
- Down from 70% to 69% in the latest figures
Manufacturing output is up in every area
- With the North West once again taking the top spot
But not enough to stop us from slipping to 9th behind France globally
- After overtaking France in 2015, we’ve slipped back to 9th in 2016 (latest data available)
Shifts between sectors
- Transport equipment overtakes chemicals and pharmaceuticals to claim the R&D top spot
- And transport is within touching distance of overtaking food and drink as the largest manufacturing sector
You can download the fact card here: www.eef.org.uk/ukmfgfacts
Or watch a two minute summary video here.